[If you missed part 1 of our series on spectrum analysis be sure to check that out here.]
Operational scans
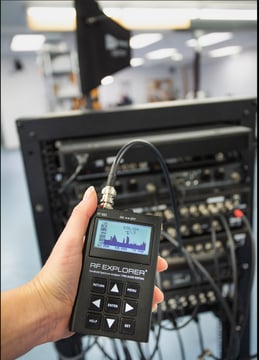
Once your system is up and running properly you’ll want to keep it that way, especially while your show is live. So the next step in the process is to capture an Operational Scan on a spectrum analyzer. And with newly available low-cost spectrum analyzers, like those from RF Explorer, and the wireless microphone manufacturers' software packages, this should be well within the reach of all wireless mic users. Flying blind is no longer an option with more devices competing for less spectrum.
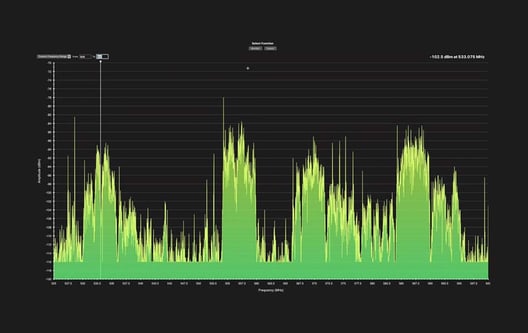
As opposed to our original Baseline Scan, which captures the environmental noise level, TV stations, and other third party sources present in the venue, an Operational Scan sees your environment through the eyes of your own antenna system. On your Operational Scans, the data displayed on your spectrum analyzer is now a real-time representation of what is happening in your system while the system is live.
A major difference between the baseline scan and the operational scan is you will now be connecting a different antenna system like a Diversity Fin or a pair of directional paddle antennas, which will often show very different conditions than if you did your baseline scan with just a whip antenna attached to your spectrum analyzer.
So for the operational scan we’ll want to switch from using an omni antenna and feed the spectrum analyzer from somewhere directly off of the wireless mic antenna system. By doing this, the spectrum analyzer is capturing exactly what the mic receivers will capture. Scanning with omni antennas or during off-hours on a site survey vs. scans generated from connected systems like Shure® Wireless Workbench receiver scans is one of the most common sources of confusion in spectrum analysis for wireless audio. So whenever possible, source your scan from your system's antennas and/or antenna distribution system so you have an apples to apples comparison of Baseline to Operational scans.
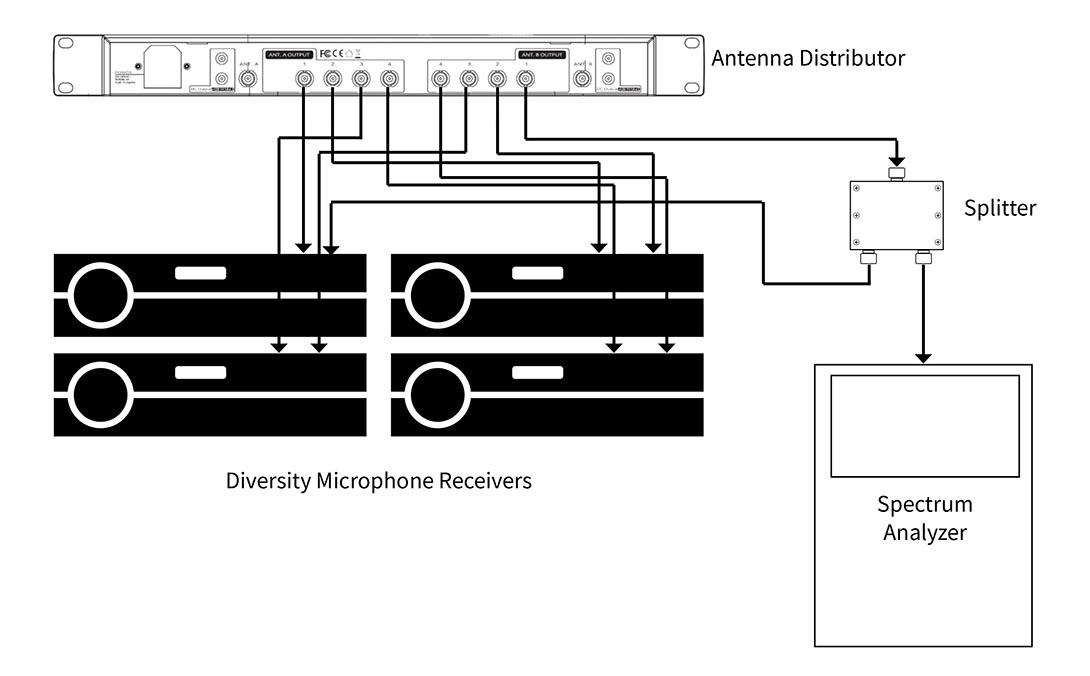 To do this, feed the antenna input of your spectrum analyzer from any unused output (including ones labeled “cascade”) or patch in a 2x1 splitter to one of the outputs from your distro as shown above. In a multi-channel system with more than one antenna distributor, it's best practice to look at the "worst case" channel, or any output at the bottom of a cascaded antenna distribution chain. For example, in an 8 channel wireless system using two antenna distros, tap the spectrum analyzer off of a spare output on the bottom distro instead of the top to get the maximum noise level present in the system. [We have some good detail on cascading distros and noise here for further reading.]
Note that you can only monitor one side of your diversity wireless microphone system at a time. So you may want to take a look at both antenna A and B and examine the differences. This is also the ideal time to experiment with antenna placement. While looking at your spectrum analyzer, try changing the angle, orientation, and position of your antennas and watch how the transmitter signal levels rise and fall accordingly. Simply moving a receive antenna for a wireless microphone system a few feet can make an enormous difference in signal to noise and overall system performance. There are also significant advantages to moving antennas closer to wireless mic transmitters, including the capture effect, which is one of the key advantages of the Spotlight antenna. Fine tuning antenna placement in crowded RF environments can be the difference between success and failure, so taking the time to monitor system performance based on antenna position in the operation scans is worthwhile. For more information on how RF signal level is affected by distance, check out this post from the archives.
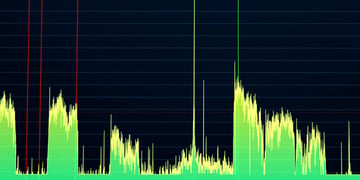
In an RF monitoring software package all transmitters that are operating properly and have signal strength above the dropout threshold will show a green marker. Monitoring like this, before your show, may be crucial even if you have used a software coordination program to set your frequencies as sometimes adjustments need to be made to the calculated frequencies. Typically setting a the dropout threshold between -90dB and -75dB makes for a good starting place and will warn you with yellow or red markers before you actually have dropouts. The goal is to keep our carrier signal (transmitter signal level) at least 20 dB or more above our noise floor. That way you can make any adjustments to your mics and IEMs before they become a problem during your show. Feel free to set it wherever you feel comfortable considering the complexity of your system and the amount of time you have available to monitor.
Stay tuned for part 3 of our series on spectrum analysis for wireless mics and IEMs where we'll examine common sources of interference and how to identify. If you have any tips or comments please feel free to leave them in the comments section below.